Inferential statistics is a branch of statistics that involves making inferences, predictions, or generalizations about a population based on a sample of data. It aims to draw conclusions or make statements about a larger group or population by analyzing a smaller subset of data, known as a sample.
Inferential statistics utilizes various techniques and methods to estimate population parameters, test hypotheses, and assess the uncertainty associated with the conclusions. It allows researchers to make broader claims and generalizations beyond the specific observations in the sample.
Central Limit Theorem
- The Central Limit Theorem (CLT) is one of the greatest statistical insights. It states that, under certain conditions, the sum or average of a large number of independent and identically distributed random variables will have an approximately normal distribution, regardless of the shape of the original distribution.
- Moreover, the mean of the sampling distribution would be equal to the mean of the original distribution and the variance would be n times smaller, where n is the size of the samples.
- The CLT applies whenever we have a sum or an average of many variables.
- CLT applies when sample size n > 30.
- The means distribution is notated like this:
Standard Error
Standard Error is the Standard Deviation of the distribution formed by the sample means.
Estimators and Estimates
- An Estimator is a mathematical function that approximates a population parameter depending only on sample information.
- A specific value is called an Estimate. Two types:
- Point Estimates – a single number. It is located exactly in the middle of the confidence interval.
- Confidence Interval Estimates – a range of numbers. Here are some estimates we have seen before.
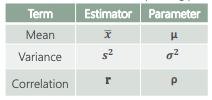
- Estimators have two important properties:
- Bias – the expected value of an unbiased estimator is the population
parameter. The bias in this case is 0. If the expected value of an
estimator is (parameter + b), then the bias is b. - Efficiency – The most efficient estimator is the unbiased estimator with the smallest
variance.
- Bias – the expected value of an unbiased estimator is the population
In statistics, an estimator is a rule or function that is used to estimate or approximate an unknown population parameter based on sample data. Estimators play a crucial role in statistical inference, where we aim to draw conclusions and make inferences about a population based on information obtained from a sample.
Here are some key points about estimators:
- Population Parameter: An estimator is designed to estimate a specific population parameter of interest, such as the mean, variance, proportion, or regression coefficients. The parameter is typically denoted by a Greek letter (e.g., μ for population mean, σ² for population variance).
- Sample Data: Estimators use sample data as input to provide an estimate of the population parameter. The sample is a subset of observations or measurements collected from the population of interest.
- Point Estimation: Estimators provide point estimates, which are single values that serve as approximations or best guesses for the population parameter. For example, the sample mean is a point estimator for the population mean.
- Bias: The bias of an estimator refers to the expected difference between the estimator’s average value and the true population parameter. An estimator is unbiased if, on average, it provides an estimate that is equal to the true value of the parameter. Bias can be positive (overestimation) or negative (underestimation).
- Efficiency: The efficiency of an estimator refers to how well it utilizes the available sample data. An efficient estimator has a smaller variance, meaning it provides estimates that are closer to the true value of the parameter compared to other estimators.
- Consistency: An estimator is consistent if it converges to the true population parameter as the sample size increases. As the sample size becomes larger, a consistent estimator provides estimates that become closer to the true value.
- Sampling Distribution: The distribution of the estimator’s values over repeated random samples is known as the sampling distribution. Understanding the properties of the sampling distribution helps assess the precision and reliability of the estimator.
- Estimation Techniques: Various estimation techniques are used depending on the nature of the parameter being estimated and the characteristics of the data. Examples include method of moments, maximum likelihood estimation, and least squares estimation.
Estimators form the basis of statistical inference, allowing us to make inferences about population parameters based on sample data. The choice of an estimator depends on the specific statistical problem and the desired properties such as unbiasedness, efficiency, and consistency. Proper selection and evaluation of estimators are essential for accurate and reliable statistical analysis.